3. Introduction to the Cyanobacteria
3.1 What Are Cyanobacteria?
Cyanobacteria are prokaryotic organisms that are taxonomically classified as members of the Kingdom Bacteria (ITIS 2020). They are a normal component of the biological communities found in water or growing at the bottom of lakes, ponds, rivers, and streams. They are also found in wetlands and many terrestrial environments.
Cyanobacteria are often called algae, a nonscientific term that includes organisms from a variety of taxonomic groups (Guiry 2019). Cyanobacterial blooms are also known as blue-green algal blooms or harmful algal blooms (HABs). In this document, we use the term harmful cyanobacterial bloom (HCB) specifically to distinguish cyanobacteria from other potentially harmful algae populations in marine and freshwater habitats.
Like many organisms that fall into the category of algae, cyanobacteria are photosynthetic organisms, meaning they use sunlight to produce energy. They can range in size from microscopic single cells to large colonies and chains of cells that exhibit a wide range of shapes and forms. Adaptations allow different types of cyanobacteria to fix nitrogen, move within the water column, and survive across a wide range of environmental conditions. They are an important component of the aquatic food web, providing energy and nutrients to other organisms in the ecosystem.
Cyanobacteria are ancient, and their fossil remnants have been found in 3.5-billion-year-old rocks in Australia (Taylor and Taylor 1993). Over the course of their evolution, cyanobacteria are believed to be the first organisms to photosynthesize, which released oxygen and led to the formation of Earth’s atmosphere as we now know it (Hamilton, Bryant, and Macalady 2016).
There are many resources available to help you learn more about cyanobacteria and the important role they play in aquatic ecosystems. Some examples include:
- General audiences:
- The Secret Life of a Lake: The Ecology of Northern Lakes and Their Stewardship (Tobiessen 2012)
- Technical audiences:
- The Ecology of Phytoplankton (Reynolds 2006)
- Limnology: Lake and River Ecosystems (Wetzel 2001)
3.1.1 A Word About Taxonomy
Cyanobacteria taxonomy is rapidly changing from morphological identification based on physical features to an approach that includes both morphological and genetic characteristics. As more genetic information becomes available, many existing taxa are being reorganized into new genera and species. Overall, these changes are helpful and logical for taxonomists; however, it takes time for the change to be fully accepted and used by everyone. The previous name is still present in older documents and outreach materials, which can be confusing. There may be no way to be sure that the organism discussed in older materials would now be identified by the new name.
In this document, we use the current taxonomic name in most cases; however, where the text refers to an older published document, we use the name found in the source material. We have constructed a short crosswalk table in Appendix A that provides the current name and the previous name for common HCB taxa. We also provide a link to one of the best sources to verify current taxonomy: AlgaeBase. A link to the crosswalk table will be available when you hover over taxonomic names throughout the document.
3.2 Health, Environment, and Economic Impacts
Cyanobacteria are common and found around the world. The following information summarizes our current knowledge on how HCBs may affect health, the environment, and local economies. This is a constantly evolving field of study, and new data are continuously emerging. Lake managers should periodically check for updates to guidance documents.
3.2.1 Human Health Impacts
HCBs can produce toxins, called cyanotoxins, and other irritants (Codd et al. 2020, Pilotto et al. 2004, Rzymski and Poniedziałek 2012) that cause serious health effects in people. Direct exposure to toxins may occur when you consume drinking water contaminated by HCBs, eat cyanotoxin-contaminated fish or shellfish, accidentally swallow cyanotoxin-contaminated water during swimming, or breathe in aerosolized cyanotoxins in water spray or mist (Carmichael 2001, Hilborn et al. 2014, USEPA 2019b). Exposure to cyanotoxins also may be possible through other avenues, such as the consumption of dietary supplements containing cyanobacteria or fruits and vegetables irrigated with cyanotoxin-contaminated irrigation water (Chorus and Bartram 1999, Lee et al. 2017) or water used in kidney dialysis (Azevedo et al. 2002). Exposure to irritating compounds produced by cyanobacteria may occur by direct contact with the HCBs during recreation or other activities.
Table 3-1 summarizes the main cyanotoxin and irritant groups, the cyanobacteria that produce them, and their known health effects. Exposure to cyanobacteria and cyanotoxins may affect your skin, eyes, nose, mouth, throat, and lungs through contact or inhalation, and your liver, stomach, kidneys, and nervous system through ingestion (Carmichael et al. 2001, Chorus and Bartram 1999, Hilborn et al. 2014). Our understanding of cyanotoxins and organisms that produce them changes frequently as new studies are released, so you should check to ensure that you are using up-to-date resources. More information is available from the Centers for Disease Control and Prevention (CDC) for the public and physicians, as well as from U.S. Environmental Protection Agency (USEPA). For information on cyanotoxin molecular structure and chemistry, see Huang and Zimba (2019). For more details on cyanotoxin exposure routes, health impacts, classes of cyanotoxins, distribution in the environment, and toxicity thresholds, see Cyanotoxins (Section 2 of HCB-2).
The CDC has developed a voluntary reporting system for HCBs and other harmful algae events. The One Health Harmful Algal Bloom System (OHHABS) provides state and territorial public health departments a system for sharing information on human and animal illness associated with HCBs as well as environmental data. Data are used to help us better understand the effects of HCBs on human and animal health.
Table 3‑1. Health impacts from various cyanobacteria, their toxins, and other compounds.
| Compound Classification | Toxins/Irritants | Most Common Cyanobacteria Producing the Compound | Main Target Organ | Effects |
| Hepatotoxins | Microcystins* | Anabaena Anabaenopsis Arthrospira Dolichospermum Geitlerinema Microcoleus Microcystis Nostoc Planktothrix Oscillatoria Phormidium Raphidiopsis Scytonema Tychonema |
Liver | Diarrhea, vomiting, weakness, liver inflammation, liver hemorrhage, pneumonia, dermatitis |
| Nodularin | Nodularia Nostoc |
Liver | Diarrhea, vomiting, weakness, liver inflammation, liver hemorrhage, pneumonia, dermatitis | |
| Cylindrospermopsin | Anabaena Aphanizomenon Chrysosporum Cylindrospermopsis Dolichospermum Lyngbya Microseira Oscillatoria Rhaphidiopsis Umezakia |
Liver and kidney | Diarrhea, vomiting, nausea, gastroenteritis, liver inflammation, liver hemorrhage, pneumonia, dermatitis, kidney damage, headache | |
| Neurotoxins | Anatoxin-a | Anabaena Aphanizomenon Arthrospira Cuspidothrix Cylindrospermopsis Dolichospermum Geitlerinema Lyngbya Microcoleus Oscillatoria Phormidium Planktothrix Raphidiopsis |
Nervous system | Muscle twitching, burning, numbness, drowsiness, salivation, respiratory paralysis leading to death |
| Guanitoxin (formerly Anatoxin-a[S]) | Dolichospermum Scytonema Sphaerospermopsis |
Nervous system | Salivation, convulsions, muscle fatigue, and respiratory arrest | |
| Saxitoxins* | Anabaena Aphanizomenon Cuspidothrix Cylindrospermopsis Dolichospermum Lyngbya Microseira Planktothrix Rhaphidiopsis |
Nervous system | Muscle twitching, burning, numbness, drowsiness, headache, vertigo, respiratory paralysis leading to death | |
| Β-methylamino-L-alanine (BMAA) | Anabaena Aphanizomenon Dolichospermum Microcystis Nodularia Nostoc |
Nervous system | Chronic exposure associated with neurodegenerative disease reported by some studies; scientific discussion is ongoing (Chernoff et al. 2017, Nunes-Costa et al. 2020) | |
| Dermatoxins and Skin-Irritating Compounds | Aplysiatoxin | Lyngbya Oscillatoria Schizothrix Sphaerospermopsis |
Skin | Skin irritation, asthma |
| Lyngbyatoxins* | Lyngbya Microseira |
Skin | Skin and eye irritation, respiratory problems | |
| Lipopolysaccharide | Anabaena Dolichospermum Microcystis Synechococcus Microcystis Oscillatoria Schizothrix |
Skin | Skin and eye irritation, headache, allergy, asthma, fever |
* Indicates that multiple isomers of the noted cyanotoxins have been identified.
Adapted in part from Sanseverino et al. (2016) and Fiore et al. (2020).
Cyanotoxins have been reported from many locations around the world (Svirčev et al. 2019). Quick and relatively inexpensive analytical methods are available for only a small number of cyanotoxins, such as microcystin, and there is more information about their distribution as a result. More than one cyanotoxin may be present in a water body at the same time, and their presence may change over the course of the year (Graham et al. 2010). Cyanotoxins may also be present in streams and rivers (Loftin et al. 2016, Carmichael 2008).
Cyanotoxins may persist in the environment after a bloom breaks down, and the time it takes them to degrade differs from cyanotoxin to cyanotoxin. It is important to consult recent guidance documents and studies to learn about environmental fate and degradation (for example, see USEPA 2015d, f, e).
3.2.2 Domestic Animal, Wildlife, and Fish Impacts
Pets and livestock that are exposed to cyanotoxins may experience excessive salivation, vomiting, fatigue, staggered walking, difficulty breathing, convulsions, liver failure, respiratory paralysis, and death (see the CDC’s veterinarian reference card). Dogs are especially at risk because of their higher exposure while drinking and swimming in affected waters, licking cyanobacteria or scum that has accumulated on their fur, or eating material along the shoreline (Backer et al. 2013). Each year, numerous pets die after consuming water or mat material containing cyanotoxins or cyanobacteria themselves. Domestic livestock like cattle are also susceptible when cyanobacteria grow in pasture or farm ponds (Dreher et al. 2019, Mez et al. 1997). Health effects may occur within minutes to days after exposure (Backer et al. 2013, Briand et al. 2003, Ferrão-Filho and Kozlowsky-Suzuki 2011, Stewart, Seawright, and Shaw 2008).
Wildlife affected by cyanobacteria and cyanotoxins include mammals, reptiles, fish, and birds, including waterfowl (Backer and Miller 2016, Lopez-Rodas et al. 2008). Fish may be exposed by direct ingestion of cyanobacteria or contact with dissolved cyanotoxins, or by indirect consumption of prey with prior exposure (Ferrão-Filho and Kozlowsky-Suzuki 2011). Endocrine disruption in fish has been reported (Oziol and Bouaicha 2010). Some cyanotoxins cause fish kills by directly interfering with gill function (Zimba et al. 2001). Dense HCBs can also cause fish and mussel deaths from local hypoxia or anoxia connected to bloom decay or nocturnal respiration in shallow waters (McInnes and Quigg 2010, Paerl et al. 2001). Fish trapped in areas of low or no oxygen may perish through their inability to escape the area experiencing the HCB.
Similar to fish, birds may be exposed through direct ingestion of cyanobacteria or indirectly through consumption of insects that have accumulated cyanotoxins or have cyanobacteria in their gut (Moy et al. 2016). Illness in bald eagles has been attributed to the consumption of coots that had been exposed to cyanotoxins through their diet of hydrilla (Wilde et al. 2005). Cyanotoxin poisoning in birds may resemble and occur at the same time as avian botulism (Foss et al. 2018), which paralyzes the body. Nearshore marine and estuarine birds may also be exposed (Gibble, Negrey, and Kudela 2017).
Mammalian wildlife may experience similar health effects to those occurring in pets and livestock (Stewart, Seawright, and Shaw 2008). In addition to terrestrial and freshwater aquatic mammals, coastal sea otters have been impacted through consumption of shellfish that accumulated cyanotoxins from freshwater discharge into downstream estuaries (Miller et al. 2010).
Any animal or wildlife illnesses suspected to be caused by HCBs should be reported to the CDC through OHHABS. It is also important to remind pet owners, farmers, and others to watch for cyanobacteria wherever their animals have access to water, including farm ponds, water tanks, decorative ponds, and containers where rainwater may collect. Section 5 of this guidance can help you develop an outreach plan for this audience.
For additional information on effects of cyanotoxins on animals, including aquatic life, see Section 2.2 of HCB-2. For more details on cyanotoxin thresholds for domestic animals, see Section 2.6.2, Cyanotoxin Thresholds for Domestic Animals.
3.2.3 Economic Impacts
HCBs have a multifaceted impact to the United States economy caused by higher drinking water treatment costs (monitoring, plant operations, capital investment, communications), loss of livestock and crops, loss of recreational or tourism revenue, undiagnosed health effects, and lower prices for real estate along waterfront properties due to unsightly conditions and foul odor. Some impacts cannot be easily evaluated (for example, undiagnosed health effects and agricultural losses), and we may not fully understand how frequent, severe HCBs affect local economies. There are surprisingly few peer-reviewed publications documenting HCB impacts, although the high costs associated with HCBs and the variability in costs specifically attributed to blooms have been calculated at local and regional levels (Table 3-2).
Table 3‑2. Compilation of HCB-specific economic impacts
| Location | Water Body | Economic Costs (2020 U.S. Dollars) | Reference |
| Australia | All freshwaters | ●$198M–$266M annually | Atec (2000) in Steffensen (2008) |
| KS | Cheney Reservoir | ●$9.52M construction of ozone facility | KDHE (2011) |
| MI | Lake St. Clair | ●$10,000/home for algae-sludge cleanup | AP News (2020) |
| Miss. | Mississippi Coast | ●Loss of $4.14M in room rental revenue due to June–July 2019 HCB ●Small Business Association loans of up to $2M/business impacted by coastal HCB |
Weatherly (2019) SBA (2020) |
| NJ | Lake Hopatcong | ●$20,000/weekend loss for marinas | U. S. Congress (2019) |
| OH | Grand Lake St. Mary’s | ●$41.4M–$52.6M loss in tourism revenue in 2009 and 2010 ●Five lakeside businesses closed in 2009 and 2010 ●$707,800 loss in cancellation of regatta ●$294,600 decline in park revenues ●$14.7M spent in 2010 by Celina, OH, to address HCB treatment and monitoring ●$53.6M loss in property values |
USEPA (2015b); Wolf and Klaiber (2017) |
| OH | Toledo | ●$54.5M upgrade in drinking water facility for toxin removal | Schechinger (2019) |
| OH | Lakes in six counties | ●$153M loss in property values over 6 years | Wolf and Klaiber (2017) |
| OH | Lake Erie | ●$5.9M loss in closure of recreational fishery ●$212M annually over 30 years from losses in tourism and recreational users, $5.3B total |
Wolf, Georgic, and Klaiber (2017); Smith, Bass, et al. (2019); Bingham, Sinha, and Lupi (2015) |
| OR | Detroit Lake | ●Salem, OR, committing ~$50M to ozone treatment for cyanotoxins in its Green Island water plant | City of Salem (2008) |
| TX | Lake Waco | ●~$50M for dissolved air flotation and ozone treatment in drinking water plant | Waco, TX |
| VT | Lake Champlain | ●$18.1M loss in economic activity and jobs for July–August tourism ●Property values depressed by 20% ($11,200 on average) when the properties are located on an area of the lake that has degraded water quality (St. Albans Bay) |
Voigt, Lees, and Erickson (2015); Young (1984) |
| WI | Tainter Lake, Lake Menomin | ●Property value reduction of $143/ft–$450/ft of shoreline in HCB-dominated lakes | Kashian and Kasper (2010) |
*See also USEPA (2015b). All costs have been converted to 2020 U.S. dollars using the Consumer Price Index; foreign currency has been converted using conversions from April 13, 2020, except Australian currency, which was estimated on August 31, 2020.
Estimated impacts to property values from declining water clarity in lakes was not discussed by sources presented in Table 3-2. Because HCBs reduce light penetration and thereby water clarity, the range of reductions in property values located adjacent to water bodies with declining clarity regardless of cause can be used as a baseline for likely reductions in property values from HCBs (Table 3-3). These costs might be higher if additional HCB concerns, like those associated with taste, odor, cyanotoxins, and aesthetics, were included.
Table 3‑3. Changes in property values associated with water clarity in multiple freshwater systems
| State | Water Body | Impact on Home Prices (2020 U.S. Dollars)* | Reference |
| FL | St. Lucie River and estuary, Indian River Lagoon | $7,165 (0.6%) increase in average property value for a 1% increase in clarity | Czajkowski and Bin (2010)* |
| ME | Lakes and ponds | $4,387 to $15,159 (3.5%–8.7%) per 1 m change in Secchi depth | Poor et al. (2001)* |
| ME | Lakes | $690 to $67,899 (<1%–78%) per 1 m change in Secchi depth | Boyle et al. (1998)* |
| ME | Lakes | $1,452 to $17,599 (1%–29.7%) per 1 m change in Secchi depth | Michael et al. (2000)* |
| MN | Lakes | $1,879 to $94,919 per 1 m change in clarity | Krysel et al. (2003)* |
| NH | Lakes | $2,140 to $18,719 (1%– 6.7%) per 1 m change in Secchi depth | Gibbs et al. (2002)* |
| OH | Lake Erie | $28 increase/cm increase in clarity; 1.93% change per 1 m change in clarity | Ara et al. (2006)* |
| Ontario (Canada) | Lakes | 8% increase in residential property price for every 1 m improvement in water clarity | Calderón-Arrieta, Caudill, and Mixon (2019) |
| VT | Lake Champlain | 1-m decrease in water clarity in July and August would lead to estimated loss of 195 full-time equivalent jobs, $13.9 million reduction in tourism expenditures, and total economic reduction of ~$18.5 million | Voigt, Lees, and Erickson (2015) |
| WI | Northern Wisconsin lakes | 3-ft improvement in water clarity would produce a 9%–16% improvement ($82,477–$94,926) in the market price of an average property on four lakes with the lowest clarity | Kemp, Ng, and Mohammad (2017) |
*Portions adapted from USEPA (2015b). All costs have been converted to 2020 U.S. dollars using the Consumer Price Index; foreign currency has been converted using conversions from April 13, 2020.
The costs summarized above do not take monitoring or mitigation costs into account. Costs associated with those activities can be high and are addressed in Sections 4, 6 and 7 of this guidance. Excellent summaries are also available in USEPA (2015b) and Sanseverino et al. (2016).
3.2.3.1 Impacts to Public Drinking Water Systems
A key route of exposure to cyanobacteria toxins is through water consumption. This is most likely to occur during recreational activities, but drinking water sources may also be affected by cyanobacteria. Both public water systems (PWSs) and home systems may be affected by HCBs in their source water or when groundwater sources are directly influenced by surface waters with HCBs.
In addition to possible impacts to humans and animals from cyanotoxins in drinking water, other HCB compounds may cause noticeable tastes and odors that are unpleasant but not harmful. Elevated levels of disinfection by-products (e.g., trihalomethanes, haloacetic acids, and N-nitrosodimethylamine) that are harmful to humans may be produced after treating large amounts of cyanobacteria with disinfectants such as chlorine and other required additives used by PWSs (Rodríguez et al. 2007, Zamyadi et al. 2012). By-products of unknown toxicity resulting from the treatment of specific cyanotoxins or decaying cyanobacteria may also occur. A long-term project investigating this situation is underway, led by the University of South Carolina. Confidence in public drinking water supplies can be compromised when HCBs occur in source water, particularly if there are taste and odor problems or reports of human or animal illness.
HCB education and training for PWS operators has been underway for many years, especially since the widely publicized events in Toledo, Ohio, in 2014. There are many ways that PWSs can change their treatment and operation to respond to the presence of cyanobacteria or cyanotoxins in source water. High levels of cyanobacteria and cyanotoxins can challenge PWSs that are not prepared or do not have flexibility in their operations to manage multiple treatment objectives. This increases risk for elevated cyanotoxin concentrations and disinfection by-products in drinking water sent out to the public; however, with increased awareness and planning by PWS operators as a result of events like those in Toledo, most PWSs can modify operations and continue to produce safe drinking water during HCBs.
Upgrades to PWS facilities in response to continued high levels of cyanobacteria in source water may be necessary and can be costly (see Table 3-2). There may be opportunities for modified PWS operation to treat for cyanotoxins that do not require expensive facility upgrades. Source water management plans can be useful tools for PWSs as well. For more information, see the USEPA web page on cyanotoxins in PWSs, the American Water Works Association’s (AWWA) cyanobacteria resources, the Water Research Foundation web page on cyanobacteria and cyanotoxins, and the drinking water discussions throughout this guidance.
3.2.4 Regulatory Requirements for Recreation and Drinking Water
There are currently no federal regulations requiring states to take specific actions when cyanobacteria or cyanotoxins exceed specific levels. USEPA has released Non-regulatory Health Advisories for recreation (USEPA 2019d) and drinking water (USEPA 2015c). In addition, many states have developed their own regulatory or guidance values for planktonic HCBs. Very few have guidance for benthic HCBs. Yeager and Carpenter (2019) provide a list of action levels for certain cyanotoxins, and USEPA is currently considering revisions to its Numeric Nutrient Water Quality Criteria guidance. The draft numeric criteria include microcystin as a tool for assessing lake water quality, leading to regulatory requirements for this cyanotoxin.
For some cyanotoxins that may be present in HCBs, there are very few peer-reviewed studies to help health officials determine the risk to human health from exposure. This makes it difficult to develop guidance for many cyanotoxins. It is also difficult—and expensive—to test for all possible cyanotoxins that may be present during HCBs. To date, most guidance and routine testing at the federal and state level is focused on microcystin, cylindrospermopsin, and, less frequently, anatoxin-a. A few states (Colorado, Ohio, Pennsylvania, Oregon, and Washington) have created guidance for saxitoxin. Check with your state’s health or environmental agency to learn if it has regulatory or guidance values for HCBs or cyanotoxins. These resources can help you:
- Section 5 of this document covers HCB response planning and includes thresholds for HCB advisories in Section 5.1.4
- USEPA’s list of state harmful algal bloom resources
- USEPA’s Recommended Human Health Recreational Ambient Water Quality Criteria or Swimming Advisories for Microcystins and Cylindrospermopsin, which contains recreational guidance for cyanotoxins, including microcystin, cylindrospermopsin, anatoxin-a, and saxitoxin (USEPA 2019e)
- the North American Lake Management Society’s (NALMS) cyanobacteria resources
3.3 Cyanobacteria Biological Functions and Environmental Interactions
3.3.1 Cyanobacteria Biology
HCBs have unique characteristics that support their ability to adapt to changing environmental conditions and compete for resources with other aquatic organisms. Examples include maintaining symbiotic relationships with other organisms (for example, lichens and the water fern Azolla spp.), controlling their depth in the water with buoyancy, using gaseous forms of nitrogen through nitrogen fixation, thriving in a variety of temperatures, and transitioning to resting stages (akinetes) that settle to bottom sediments until conditions can once again support growth (Cirés et al. 2013).
Cyanobacteria may be found floating in the water (planktonic), attached to structures and plants in the water (periphytic), or growing on the bottom of the water body (benthic). Cyanobacteria may grow as single cells, as multicellular colonies of many shapes, or in filamentous forms called trichomes. Often very specific adaptations help cyanobacteria thrive in habitats where other organisms cannot, such as in hot springs. For more information on cyanobacteria, their internal cellular processes, and their ecological adaptations, textbooks on freshwater algae or limnology can be helpful (Wetzel 2001, Wehr, Sheath, and Kociolek 2015). For more details on the benthic cyanobacterial mats, see Section 1.3 of HCB-2.
3.3.1.1 Factors That Impact Production of Cyanotoxins and Other Bioactive Compounds
Cyanobacteria produce a suite of recognized cyanotoxins (see Table 3-1) and other less studied compounds that pose potential threats to humans and wildlife. The less studied compounds include a number of toxic bioactive peptides that co-occur with and follow the same concentration patterns observed for microcystins (Beversdorf et al. 2018, Janssen 2019). It is not clear why cyanobacteria produce all these compounds, and factors that favor synthesis are highly variable.
We have much to learn about cyanotoxins and why they are produced. Not all cyanobacteria produce cyanotoxins, and those that can do not produce them all the time. HCBs may contain a mixture of toxic and nontoxic taxa, and the toxicity of an HCB can change over time. It is not possible to tell whether cyanotoxins are present without specifically testing for them. Therefore, it is best to avoid contact with any suspected HCB.
Cyanotoxins are produced within the cells (intracellular toxins) and generally remain there until the cell wall is breached or the cell decays (USEPA 2014). Cyanotoxins outside the cell (extracellular toxins) are not visible to the human eye and are not easily removed by treatment options. See Section 2.4 of HCB-2, Cyanotoxin Distribution, Stability, and Exposure Considerations for more details. This is an important consideration when reviewing in-lake treatment options or evaluating drinking water sources.
3.3.2 HCB Environmental Interactions
3.3.2.1 Nutrients
HCB species, like all living organisms, require nitrogen and phosphorus for growth. While they may be found in water bodies of all nutrient concentrations, HCBs are more frequent and severe in nutrient-rich waters (Paerl and Otten 2013). For many years, managing phosphorus in freshwater and nitrogen in marine waters has been the primary means of control for cyanobacteria. Increasingly, there is recognition that both nutrients have a role in the promotion of HCBs in freshwater (Paerl and Otten 2013). Nutrient management on land is key to reducing the occurrence of HCBs in the water, with those sources strongly controlling the growth potential of cyanobacteria and algae in our waters.
Cyanobacteria have highly variable mechanisms to take up phosphorus from the environment that differ between species and even between strains of the same species. Some can absorb phosphorus when it is abundant in the water and store it as polyphosphate granules for later growth (Kromkamp 1987). The ability to capture or store phosphorus influences which species of cyanobacteria grow in a lake and when they are most abundant. It also influences when toxin- versus nontoxin-producing strains of the same species may be present. For example, Harke et al. (2016) found M. aeruginosa in the open waters of Lake Erie, where the concentration of phosphorus is low, while Anabaena and Planktothrix were dominant in high-phosphorus waters around the mouth of the Maumee River.
There are strong positive relationships between total nitrogen, water temperature, and cyanobacteria biomass (Beaulieu, Pick, and Gregory-Eaves 2013, Kosten et al. 2012). As noted above, microcystin, cylindrospermopsin, nodularin, and saxitoxin also contain nitrogen, and the availability of nitrogen may influence their production. Nitrogen is stored as cyanophycin (arginine-aspartate polymers) in cyanobacteria (Kromkamp 1987). Several HCB species can fix nitrogen using unique oxygen-free cells called heterocytes (Benayache et al. 2019, Kumar, Mella-Herrera, and Golden 2010) and may also have morphological features that create oxygen poor micro-zones within colonies or filament bundles (Paerl 1985).
Nutrients are released to water bodies in several ways. External nutrient loading refers to nutrients washed into surface water or groundwater from the land. These nutrients can be in particulate or dissolved form and may be of organic or inorganic origin. Nutrients can also reach surface waters through air deposition (Mast et al. 2002). External loading to surface water and groundwater is increasing globally (Vilmin et al. 2018). External loading to a water body can be addressed by the strategies outlined in Section 7.
Internal nutrient loading occurs when chemical conditions in the water body itself release nutrients back into the water from places where they otherwise would be unavailable for cyanobacteria. HCBs often increase the pH of water during daytime photosynthesis, which releases phosphorus from sediments (Gao et al. 2012, Seitzinger 1991). Deeper water bodies may stratify, with low-oxygen layers (hypoxia) developing near the bottom that allow for the release of additional phosphorus and ammonium into the water (Cornwell et al. 2016, Wetzel 2001). Benthic cyanobacteria growing at the bottom of lakes and rivers may slow diffusion of oxygen into the sediments and create micro-zones of low oxygen that stimulate the release of nutrients from the sediments. Internal loading is addressed by several strategies discussed in Section 6.
3.3.2.2 Water Temperature
Generally, HCBs are more likely to occur in summer and late fall, but they may also occur in the winter under ice. Water temperature plays an important role in many planktonic HCBs, especially when near-surface temperatures exceed 77°F/25°C (Figure 3-1). Higher temperatures will depress growth of many planktonic algae (for example diatoms, dinoflagellates, and chlorophytes) while encouraging growth of planktonic cyanobacteria species (Paerl 2018). Other HCB species prefer lower temperatures and have special pigmentation that allows them to survive well below the surface, where there is less light. Still others, such as several cold-preferring Planktothrix species, survive in mid-depth near the thermocline (Boscaini et al. 2017) or near the bottom, where cold spring water enters lake bottom areas during the summer, and later can rise to the surface to form dense winter blooms capable of producing microcystin (Mattheiss, Sellner, and Ferrier 2017).
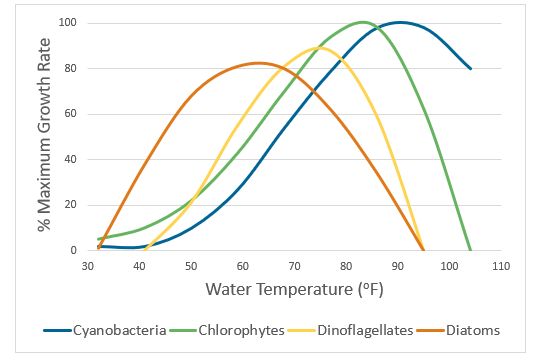
Figure 3‑1. High temperature selection of cyanobacteria relative to other common phytoplankton groups.
Source: Modified from Paerl (2014). Used with permission.
Benthic cyanobacteria communities show similar adaptations. The interactions of temperature with a system’s water quality, its flow regime, and bottom substrate determine which HCB species dominate. In the upper Potomac River, Planktothrix isothrix and Lyngbya wollei are observed in the temperature range of 21o–27oC during low-flow periods (Stanfield 2018).
3.3.2.3 Water Column Mixing, Residence Time, and Flow
HCBs are affected by water movement. Many planktonic HCB species can control their buoyancy, moving to the surface for sunlight or descending to depth at night under calm conditions to absorb nutrients (Paerl and Otten 2013). Any repeated physical mixing of a water column selects for non-cyanobacteria and reduces the chance of HCB formation (Visser et al. 2016). Under stable water conditions, planktonic HCB species are tolerant of the higher temperatures and higher light intensities at the surface that may damage other plankton (Paerl and Otten 2013). They can physically shade other algae (Table 3-4) and produce compounds that inhibit competitors.
Table 3‑4. Role of water movement in planktonic cyanobacteria abundance and physiology
| System Status | Effect |
| Stable | Stratification intact Cyanobacteria favored via advantages in buoyancy or ability to survive in lower layers of the water column. Buoyancy regulation allows cyanobacteria to reach deeper waters that may have more nutrients than upper waters. Other organisms are shaded or settle out or are inhibited by cyanobacteria allelochemicals. |
| Mixed | Stratification disrupted. Cyanobacteria lose their buoyancy advantage. Due to faster growth rates, chlorophytes and diatoms dominate. |
| High Turbulence | Very fine-scale mixing. Buoyancy advantage is lost. Disruption of filament bundles, destruction of low-oxygen micro-zones, reduction of photosynthesis, and dispersion of allelochemicals. |
Turbulence (mixing at the finest scales) damages planktonic cyanobacteria by disrupting filament bundles, destroying the low-oxygen micro-zones important in nitrogen fixation, reducing photosynthetic activity, and dispersing the released metabolites that are potentially important in grazing defense or competitive exclusion of other algae (Paerl et al. 2001).
Slow flow and long residence times provide an opportunity for planktonic HCB growth in nutrient-rich systems (Romo et al. 2012). In contrast, rapid flow would flush the slow-growing HCBs from a water body (Paerl and Paul 2012). Similar opportunities are available for HCBs in rivers, where flow and temperature determine whether benthic HCBs may persist (Cha et al. 2017, Stanfield 2018). Slower flow and stagnation reduce removal of benthic mats in rivers, and HCBs’ tolerance for warmer waters means that they can be a common occurrence in some riverine systems. Benthic cyanobacteria often reestablish after scouring events. They may detach during periods of higher flow and establish in new areas downstream (Figure 3-2).
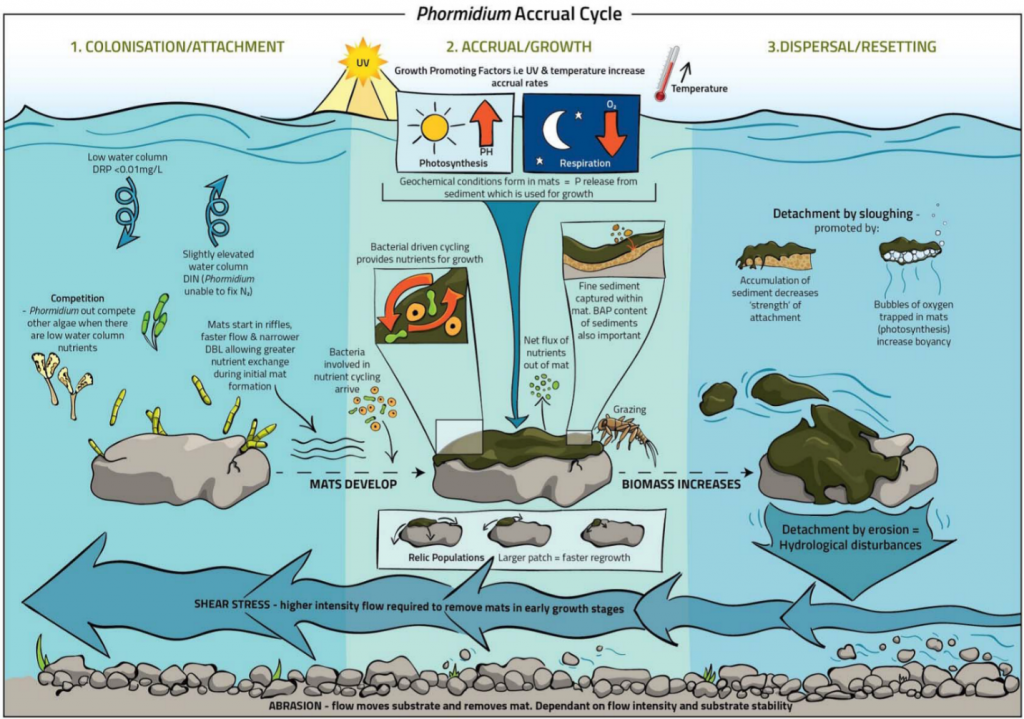
Figure 3‑2. Process and water quality conditions that influence one taxon of benthic cyanobacteria in flowing water (Phormidium).
Source: Wood et al. (2015). Used with permission.
Water column disturbance (for example, artificial circulation, Table 6.1) can be used as a prevention strategy. You should be aware that water column disturbance and agitation during HCBs may increase the release of cyanotoxins from the cells.
3.3.2.4 Other Controls on Cyanobacteria Growth
The role of rooted aquatic plants.
Competitive interactions between cyanobacteria and rooted aquatic plants can determine whether a lake remains clear or becomes cloudy. When nutrients are being used for growth by healthy plant communities, there may be less nutrient for cyanobacteria, reducing the number and intensity of HCBs in the water body. At the other end of the spectrum, intense annual HCBs limit the amount of light entering the water body and can significantly reduce growth of aquatic plants over time. This means nutrients that would have been captured in plant material now feed the cyanobacteria instead. In addition to competing for light and nutrients, cyanobacteria can also produce allelopathic compounds that inhibit growth of algae and aquatic plants. Reducing HCBs may lead to an increase in aquatic vegetation. For more information, see Scheffer (1997) and Wetzel (2001).
The role of aquatic food webs.
Planktonic cyanobacteria are important members of the aquatic food web, providing energy through photosynthesis and sometimes nitrogen through nitrogen fixation. They are consumed by herbivorous zooplankton and protozoans that, in turn, are eaten by predatory zooplankton and fish. When cyanobacteria numbers are low, grazing by zooplankton can keep cyanobacteria populations under control. When fish or predatory zooplankton decrease the number of smaller zooplankton, cyanobacteria can grow more quickly (Sarnelle 2007, Wetzel 2001). Changes in the aquatic food web, like the introduction of invasive species (for example, zebra mussels and spiny water flea), can have cascading effects that ultimately influence how well cyanobacteria grow (Vanderploeg et al. 2001).
3.3.2.5 Climate Change
Many scientists have concluded that climate change is likely to increase the magnitude, frequency, and extent of HCBs in fresh and brackish waters (Carey et al. 2012, Griffith and Gobler 2020, Moss et al. 2011, O’Neil et al. 2012, Paerl and Huisman 2009, Visser et al. 2016). Many of the environmental conditions discussed previously in this Section are expected to change as the climate warms, resulting in environments that favor strong cyanobacterial growth:
- Warmer temperatures in spring and fall will extend the cyanobacteria growing season. Higher water temperatures will also increase water column stability and the length of time when water stability is high, favoring cyanobacteria. Longer periods of stable water may lead to increased internal loading.
- Warmer temperatures will likely change soil chemistry so that more nutrients may be released during storms, which are predicted to be more frequent and more intense. Higher intensity storms will carry more nutrients by stormwater to local receiving waters from all land use sectors. The timing of these higher intensity storms is likely to coincide with periods when cyanobacteria growth typically is higher.
- Longer drought periods may further concentrate nutrients through evaporation, increase water temperatures, and increase water stability. Drought will also reduce water levels in flowing waters, allowing light to reach the bottom and allowing growth of benthic cyanobacteria.
- Increased nutrient loading may create a feedback loop that benefits cyanobacteria. Along with discoloration caused by higher sediment loads, higher nutrient loads may stimulate higher growth of algae and cyanobacteria, which can further discolor the water. Discolored water may absorb and retain more heat from sunlight, leading to warmer waters that favor cyanobacteria (Figure 3-1).
- Warmer temperatures will likely increase the number of smaller zooplankton species that are physically unable to consume cyanobacteria, allowing cyanobacteria proliferation as grazing decreases.
3.4 Understanding Your Water Body and Developing an HCB Management Plan
3.4.1 The Role of a Management Plan
It is important to know your water body’s historical and current water quality condition when managing for cyanobacteria. A good HCB management plan documents the condition of the water body and its watershed, identifies relevant data sources, highlights potential drivers and contributing factors, and identifies uses and end points of value. HCB management plans summarize a current understanding of the water quality issue in a specific water body and identify knowledge and data gaps. This information is important when considering management strategies to address the problem.
Management plan frameworks are available from NALMS and USEPA (2008, 2013b). A management plan focused on cyanobacteria may be part of a larger watershed plan, a drinking water source protection plan, or a larger nutrient management plan such as a Total Maximum Daily Load (TMDL).
3.4.2 Key Components of an HCB Management Plan
Federal regulations require states and some tribal authorities to characterize water bodies by the type of use they support, such as fishing, shellfishing, recreation, PWS, agriculture, industry, and navigation. To protect these designated uses, a state, tribe, or territory establishes specific quantitative or qualitative guidelines known as Water Quality Standards (WQS) that outline acceptable levels for pollutants. It is important to be familiar with the WQS in your state as you identify the goals you wish to achieve through HCB management actions.
Your management plan should summarize and analyze available data and identify data gaps. For HCBs, many different types of data are important:
- Nutrient concentrations: Key elements like phosphorus and nitrogen regulate the growth of cyanobacteria and algae. Nutrition management is necessary to reduce HCB growth. Consideration of internal versus external loading of nutrients may be an important component of your plan.
- Land use in the watershed: Because a water body responds to nutrient inputs from the land that surrounds it and its tributaries, land use across the watershed matters. Your plan may be able to focus on one land use to achieve nutrient reduction goals, but usually you need to consider more than one. The transport mechanisms that carry nutrients from the land are also important (for example, groundwater, stormwater, or air deposition).
- Water body characteristics: The physical structure of a water body influences internal processes and may affect how an HCB develops. Information on total acreage, variability in water depth, shoreline length and complexity, circulation patterns, and the presence or absence of control structures are relevant to HCB management.
- Weather patterns, water temperature, and streamflow: Precipitation levels influence when and how many nutrients reach a water body. Climate drives water temperature and other seasonal patterns that regulate cyanobacteria growth. The effectiveness of management approaches may be influenced by these characteristics.
- Biology and food web structure: Cyanobacteria are part of natural communities in our water bodies. Competition for nutrients from algae and aquatic plants regulates the level of nutrients available for cyanobacteria. Fish and zooplankton may eat cyanobacteria. This interconnected community means that changes in the food web may influence the development of HCBs.
- Past HCB patterns: The timing of HCBs and the genera that are present varies greatly among water bodies. A basic understanding of cyanobacteria community dynamics is essential for your management plan because it informs your management choices. Management strategies that prevent future HCBs typically are put in place before cyanobacteria become abundant. Strategies that target ongoing HCBs may not be effective for all cyanobacteria (e.g. may be effective at treating planktonic species but not benthic species). Basic understanding of community dynamics is essential for your management plan.
Once you have evaluated available data, characterized your water body, and outlined the changes you would like to achieve, you can identify strategies that will help you achieve your goals. As strategies are put in place, it is important to continue to monitor and collect data to evaluate how well your strategies are working. Periodically reviewing monitoring data will help you determine if you are reaching your goals. Your HCB management plan ties this all together and sets relevant milestones.
The next Sections in this document share common approaches to monitoring for cyanobacteria and cyanotoxins, highlight nutrient reduction strategies for different types of land use, and provide an overview of in-lake management approaches that have been used for HCBs. Management plans commonly include elements from all these areas and serve as a vehicle to communicate about them with stakeholders.

